A little LLM lab on the DGX Spark
For a while I wanted to run a serious model at home — one I could actually point my tools at, watch it work, and not think about. Not a cloud endpoint I pay per token, and not a laptop that chokes. Just: a model, a clean way to talk to it, and a dashboard I could trust.
That’s what ended up living on my DGX Spark. A single desktop box, quiet enough to sit on a desk, now runs a 27B-class model and serves it the way my tools expect — and the whole thing is described in one config file.
Everything in this post — the CLI, the model recipes, the dashboards, the docs — lives in the spark-lab repo.
The stack, in plain terms
The short version: SGLang runs the model and speaks an OpenAI-compatible API. LiteLLM sits in front of it as the thing I actually talk to — it hands out API keys, tracks spend, and gives the model a stable name that survives me swapping models underneath. Prometheus scrapes metrics from the model, the GPU, and the host, and Grafana turns that into dashboards I can actually read. Tailscale lets me reach the gateway from any of my machines over a private mesh; a Cloudflare Tunnel is there if I ever want to share it with a friend.
Nothing here is exotic. The interesting part is how little I have to manage.
One config, one command
Instead of a pile of copy-pasted scripts, everything is generated from a single
config.yaml. Pick the model, the ports, which dashboards you want, whether you
want the tunnel on. Then:
$ spark-lab init
$ spark-lab apply
apply is the part I like. It’s declarative: it renders the whole stack from your
config, works out what actually changed since the last time you ran it, and only
touches that. Change the model, add a dashboard, bump a port — run apply again and
the node converges to the new state. No more “which of the three files did I edit,
and which service do I need to restart?”
Here it is actually running — SGLang up, and the gateway plus its supporting services healthy:
$ sparkrun status
Job: recipes/qwen38-27b-dspark-nvfp4.yaml  [62cafcefd78a4fcf]  (1 container)
  solo       127.0.0.1                                 Up 27 hours   lmsysorg/sglang:qwen38-27b
  logs: sparkrun logs 62cafcefd78a4fcf
  stop: sparkrun stop 62cafcefd78a4fcf

Total: 1 container(s) across 1 host(s)

$ docker compose ps
NAME                     SERVICE          STATUS
litellm-litellm-1        litellm          Up 7 hours        0.0.0.0:4000->4000/tcp
litellm-db-1             db               Up 43 hours (healthy)
litellm-redis-1          redis            Up 43 hours (healthy)  0.0.0.0:6379->6379/tcp
litellm-prometheus-1     prometheus       Up 42 hours       0.0.0.0:9090->9090/tcp
litellm-grafana-1        grafana          Up 43 hours       0.0.0.0:3000->3000/tcp
litellm-node_exporter-1  node_exporter    Up 31 hours       0.0.0.0:9100->9100/tcp
litellm-dcgm_exporter-1  dcgm_exporter    Up 42 hours       0.0.0.0:9835->9835/tcp
And the GPU is doing work — two processes, the model and its scheduler:
$ nvidia-smi
|   0  NVIDIA GB10                    On  |  0000000F:01:00.0 Off |       N/A |
| N/A   66C    P0             43W /  N/A  |  Not Supported        |    96%    |
+-----------------------------------------------------------------------------------------+
| Processes:                                                                              |
|    0   N/A  N/A         925214      C   /usr/bin/python3                        6316MiB |
|    0   N/A  N/A         926002      C   sglang::scheduler                       10223MiB |
(That Not Supported for memory is the GB10 being honest with you: the GPU shares
unified memory with the host, so it doesn’t report a fixed VRAM number the way a
discrete card would. The monitoring stack accounts for that.)
What you get
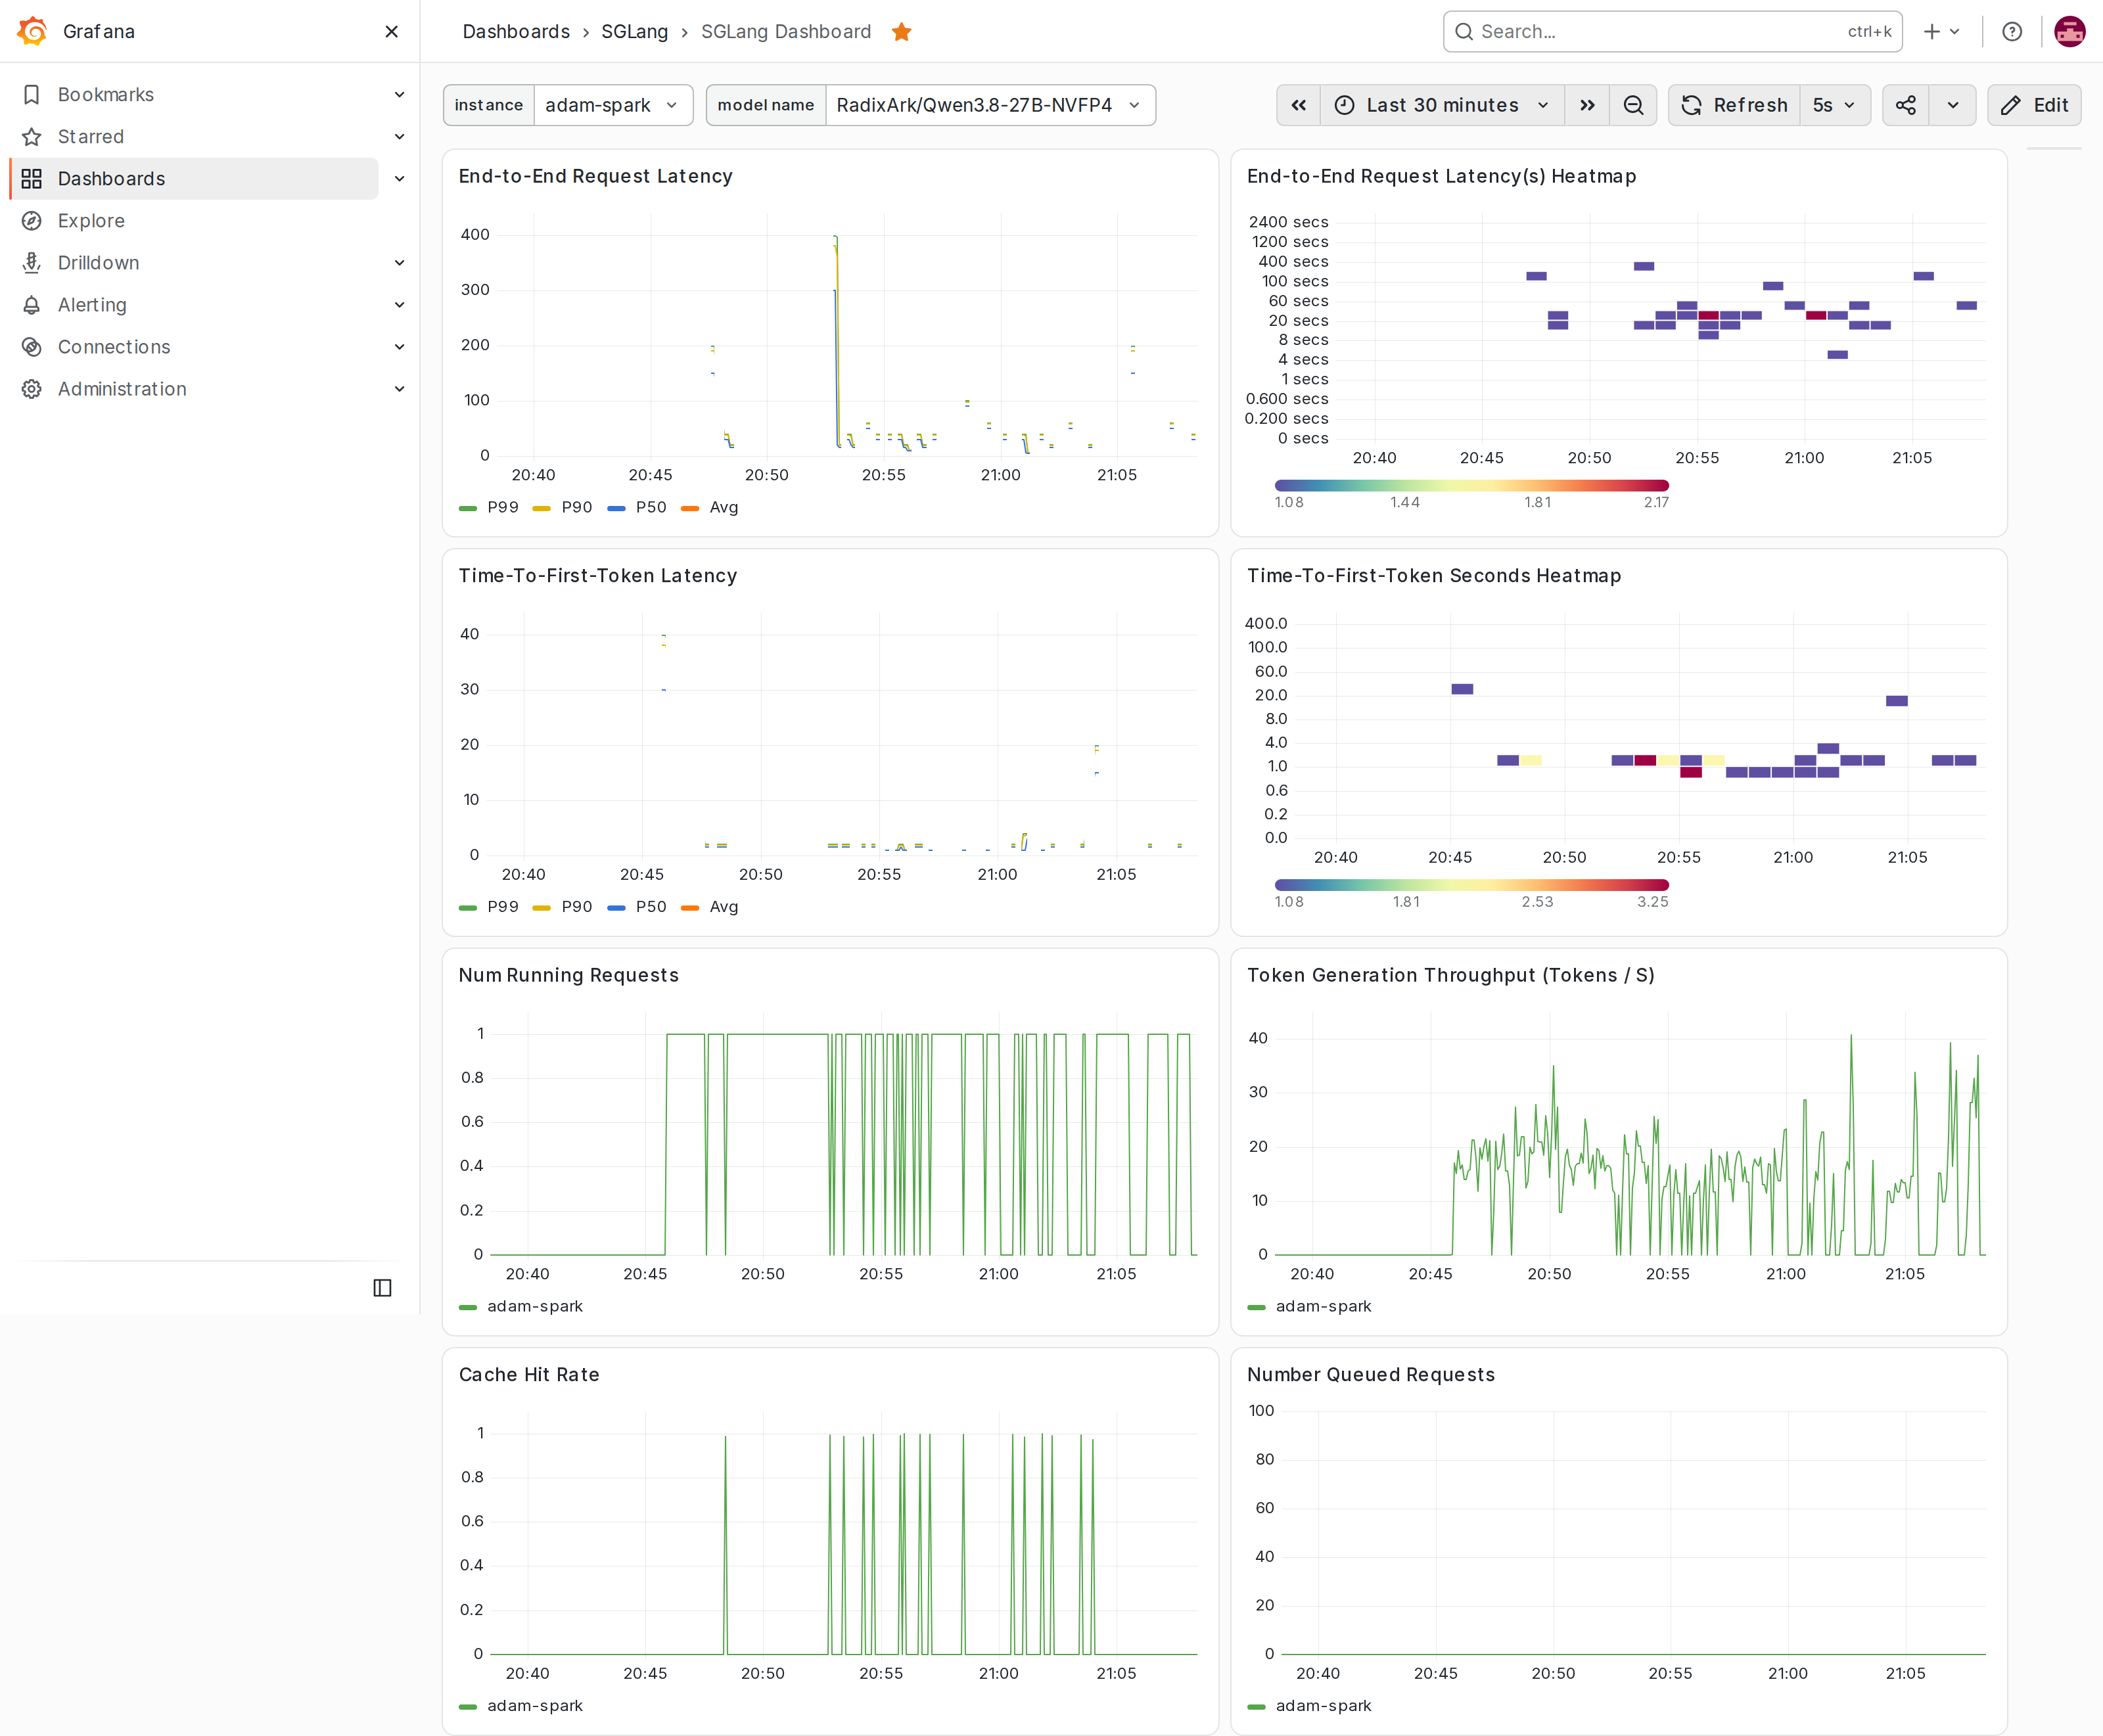
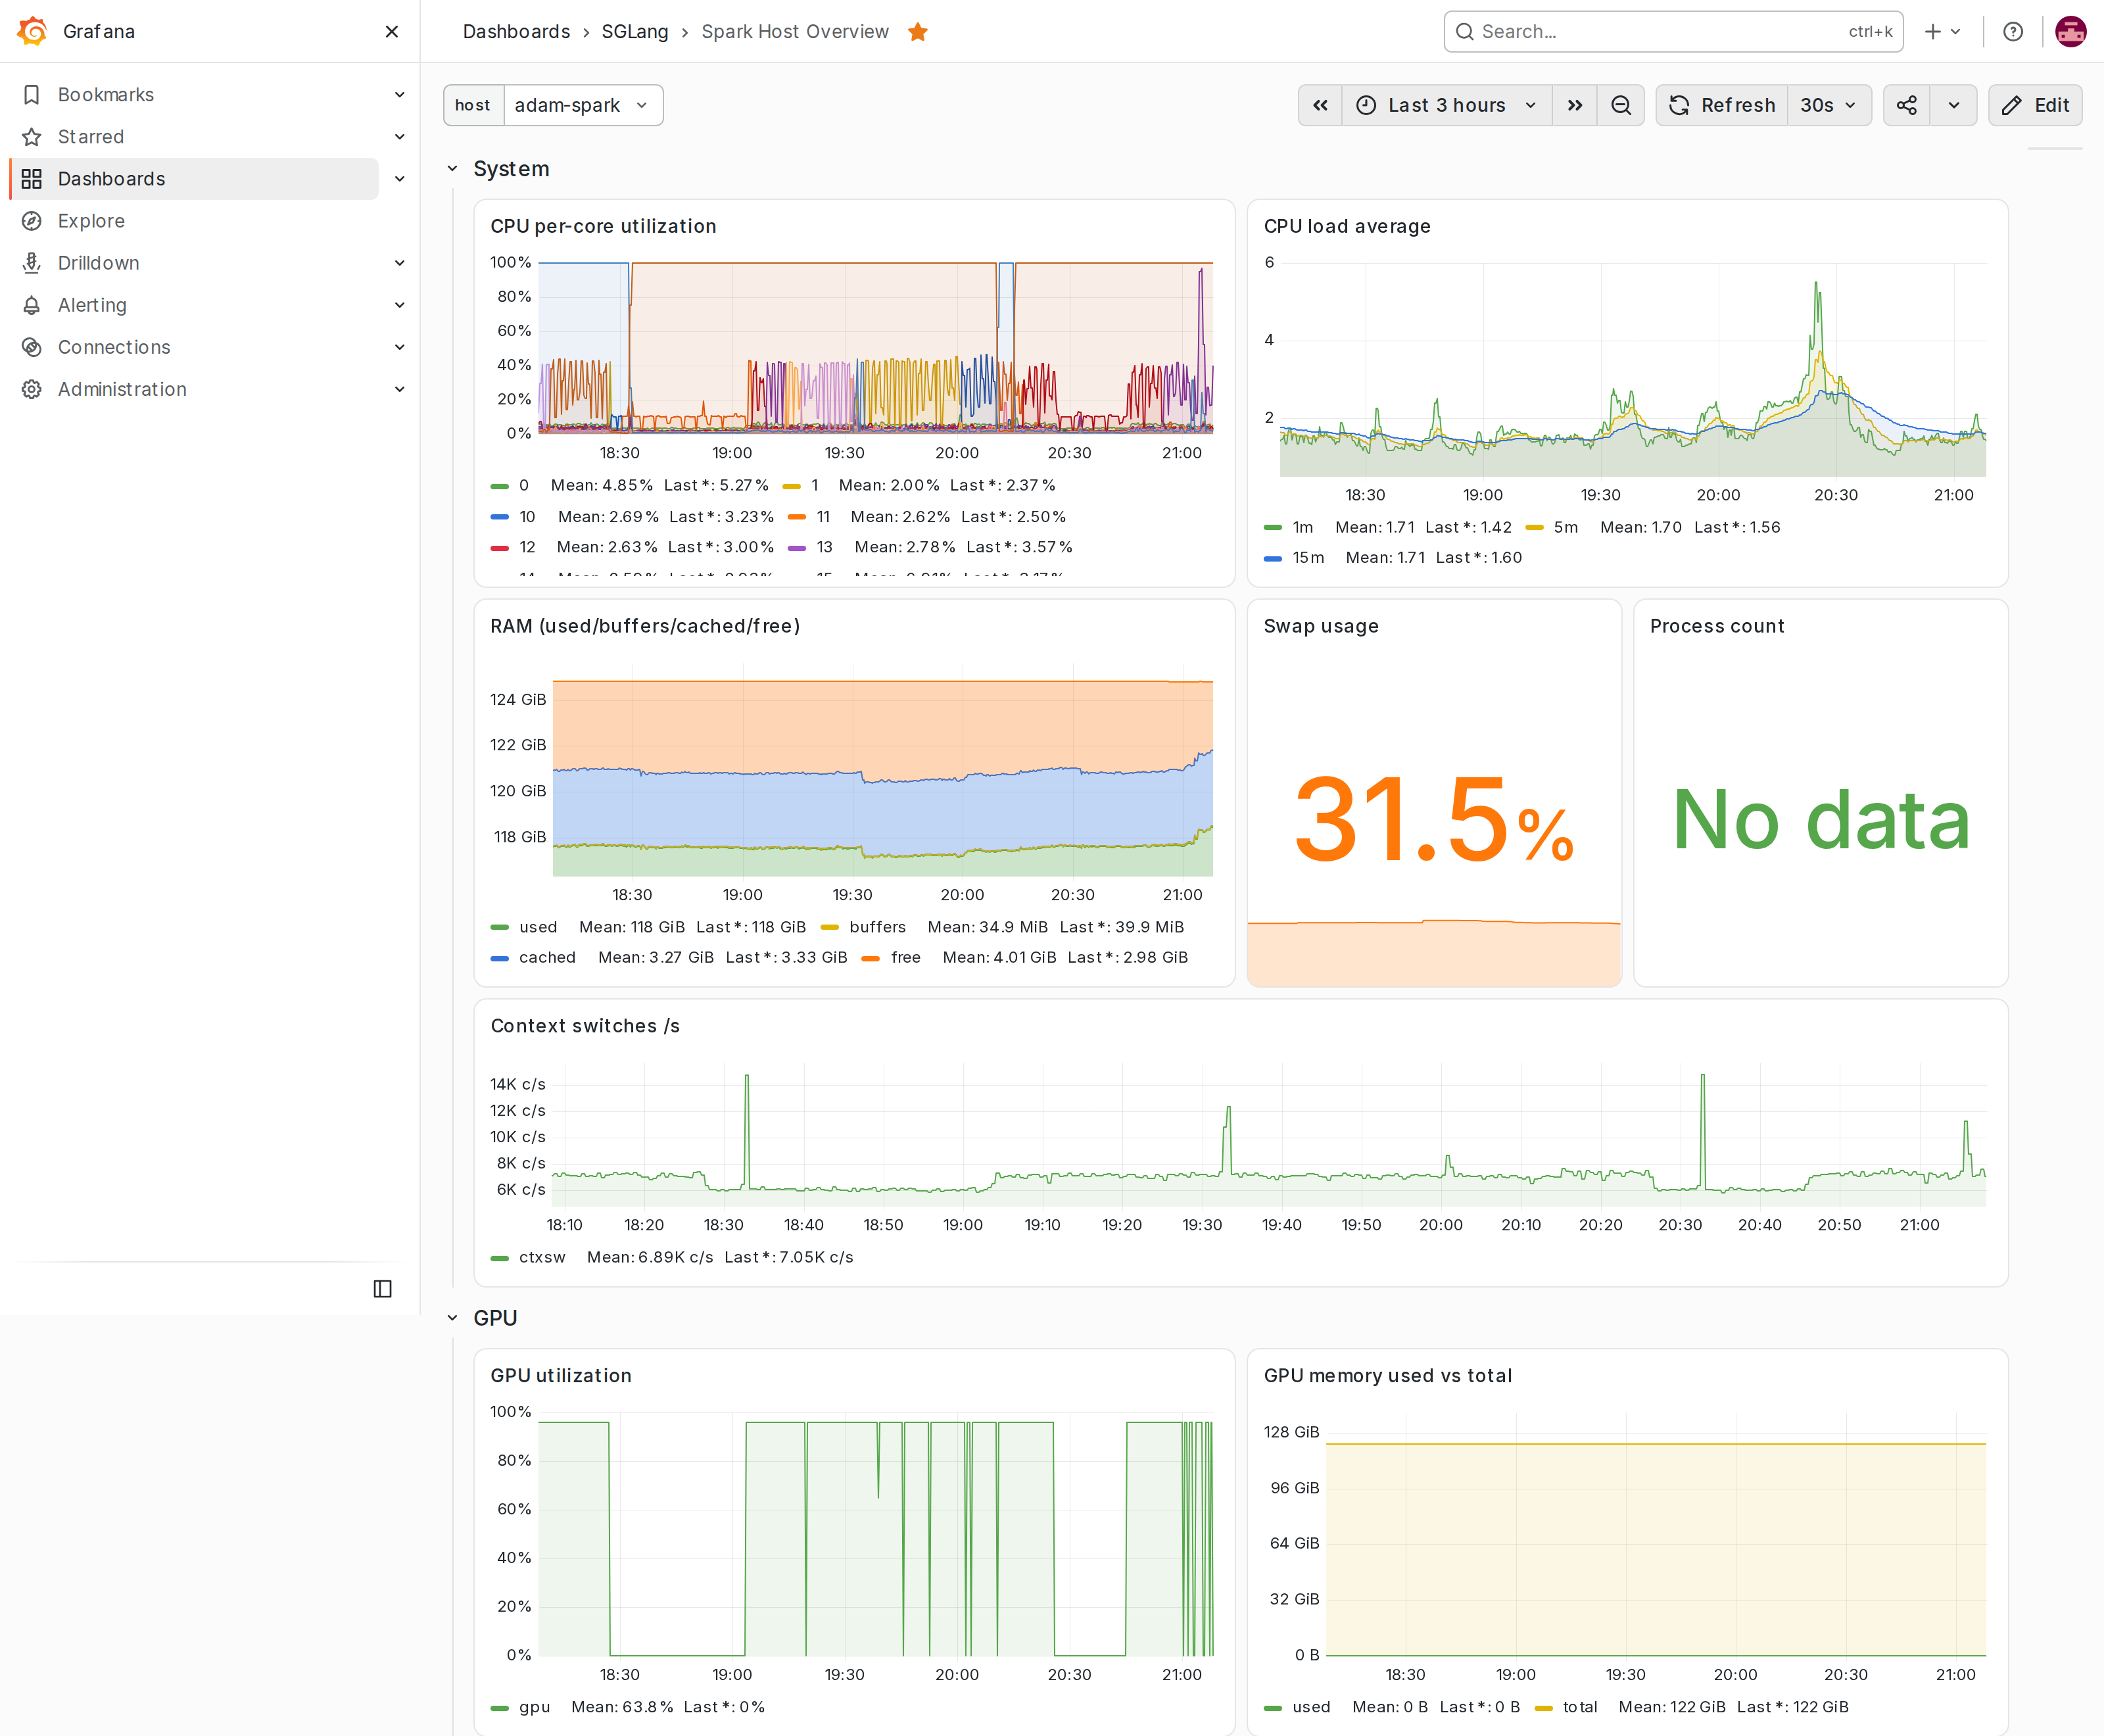
A Grafana you can actually read is the payoff. There’s an SGLang dashboard — request latency, time-to-first-token, throughput, queue depth, cache-hit rate — and a host-overview one tuned for the GB10.
Reaching the model is just “point any OpenAI-compatible client at the gateway with your key”:
curl http://<your-spark>:4000/v1/models -H "Authorization: Bearer $LITELLM_MASTER_KEY"Over Tailscale it’s even simpler — the Spark shows up on the mesh like any other device, so any of my laptops can use the model without a single open port:
$ tailscale status
100.71.216.115   my-spark     linux
100.86.52.50     pop-os       linux    active; direct
100.77.2.33      startos      linux
If I did want to share it publicly, the Cloudflare Tunnel is the escape hatch — front the gateway with a token and hand out a LiteLLM key. I keep that off by default, because “I can share a model with a friend” and “the model is public” are very different sentences.
Run it on your own
If you’ve got a DGX Spark — or a rack of them, because it scales across nodes the
same way — clone the repo, spark-lab init, point config.yaml at your model, and
spark-lab apply.
It’s MIT-licensed, and it’s just me tidying up a setup I actually use — so expect it to read more like a well-organized toolbox than a product. The docs cover the architecture, day-2 operations, model recipes, and networking.